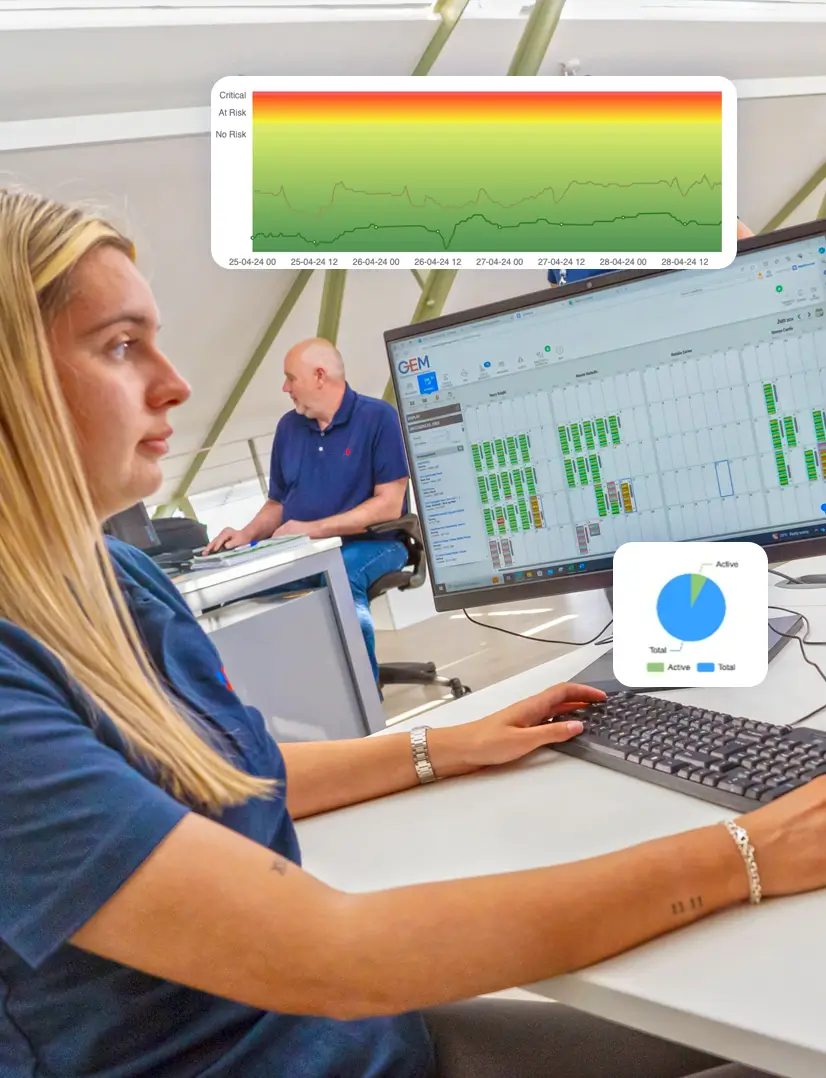
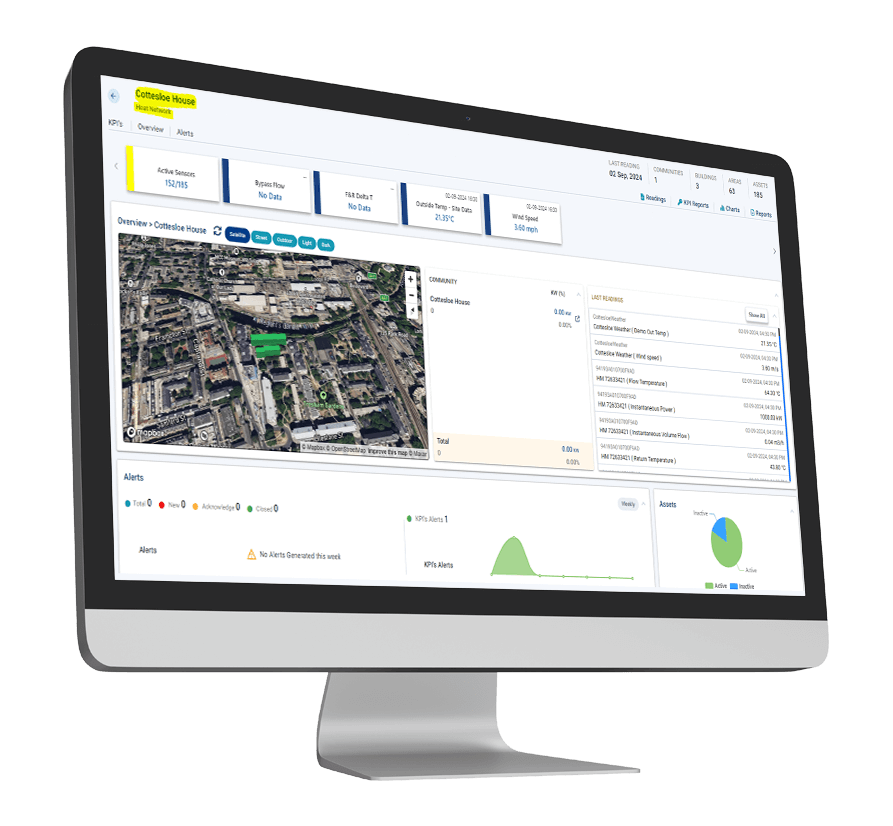
Energy usage analytics, visualisation, and reports are integral components of our heat network monitoring system, designed for ease of use and to provide deep insights into energy usage and system performance. This functionality involves collecting and analysing data from various points within the heat network, such as temperature, pressure, and flow rates and then presenting this data through intuitive dashboards and visualisations.
These tools enable property managers to monitor real-time performance, identify inefficiencies, and track energy consumption trends. Comprehensive reports are generated to offer detailed insights into energy usage patterns, operational costs, and compliance with regulations. By leveraging these analytics and visualisations, users can make informed decisions to optimise energy efficiency, reduce costs, and enhance overall system performance.